Trading TREND or REVERSAL or BOTH?
- Admin Bernhard

- Jan 16
- 5 min read
Let's first understand what a trend is.
Traders say, "The trend is your friend."
Some add, "...until the end when it bends."
This phrase has stood the test of time because trends are critical to any trading plan. We try to identify the strongest trends in the market. Use ACS28 on a higher time frame (H4, D1, W) to get the strongest and weakest currencies and combine them to get the trend of a pair. Example: If we see JPY weak and USD strong, then we have an UPtrend in USDJPY.

Confirmation of the trend:
First, we see a strong USD against a weak JPY.
Second, we see supply zones being broken (9 in a row) but not demand zones.
What are the best TimeFrames for Forex trading?
Typically, novice or inexperienced traders look into a specific time frame and ignore the more powerful primary trend. Alternatively, traders may trade the primary trend but underestimate the importance of refining their entries on an ideal short-term timeframe.
By determining the overall direction on a higher time frame and trading in that direction, you ensure that you are trading in the direction of the overall trend - this increases your chances of making profitable trades.
Understanding time frames will help you identify trends between two time frames, especially when there are opposing trends. Markets exist in multiple time frames at the same time. Therefore, there may be conflicting trends within a given symbol, depending on which time frame is being looked at. It is not uncommon for a symbol to be in a primary uptrend while also being in intermediate and short-term downtrends.
As a rule of thumb, a ratio of 1:6 or more should be used when switching between time frames.
Said this way, our TF choice will be:
m5 - h1 (optional m15 - h4) (for experienced traders).
m30 - h4 (good for beginners)
h4 - Daily (optionally also possible h1 - Daily)
Daily - Weekly
Beginner traders should set their time frames as high as possible, at least M30 or higher.
Warning. Until analysis with longer time frames is mastered, a novice trader should generally avoid trading with the 1-minute to 15-minute charts: Even though trading in low minute charts offers many trading opportunities, it is not advisable for beginners and intermediate level traders. The movements of prices in lower minute charts are very fast, which makes it riskier to trade them.
You start with the higher time frame and then work your way down.
If you are a beginner, and use the 4-hour time frame to judge the bigger picture, and use the 30-minute chart as the lower time frame.
The other method I use to find a trend is to use the Advanced Dashboard for Currency Strength and Speed. The highest time frames are the most meaningful in the long run. There may not be a signal to see every day.
After that, find your trading setup on a lower time frame.
Be careful when the strength numbers are bold and yellow or pink. This means that the CS is at extreme levels and a pullback or consolidation could be expected for some time.

Definition Pullback and Reversal:
Pullbacks or retracements are temporary price movements that occur within a larger trend that does not reverse the trend.
A reversal, on the other hand, is when the larger trend changes direction.
Any reversal begins first as a pullback.
A pullback can occur at any time, but it is likely expected when:
CS is at an extreme MFib level (above +100/below -100).
In an uptrend, the price is near a supply zone. In a downtrend, the price is near a demand zone.
We consider a pullback as a reversal when:
CS came from an extreme level and crossed the zero line backward.
In an uptrend, the price broke through a demand zone. In a downtrend, the price broke through a supply zone.
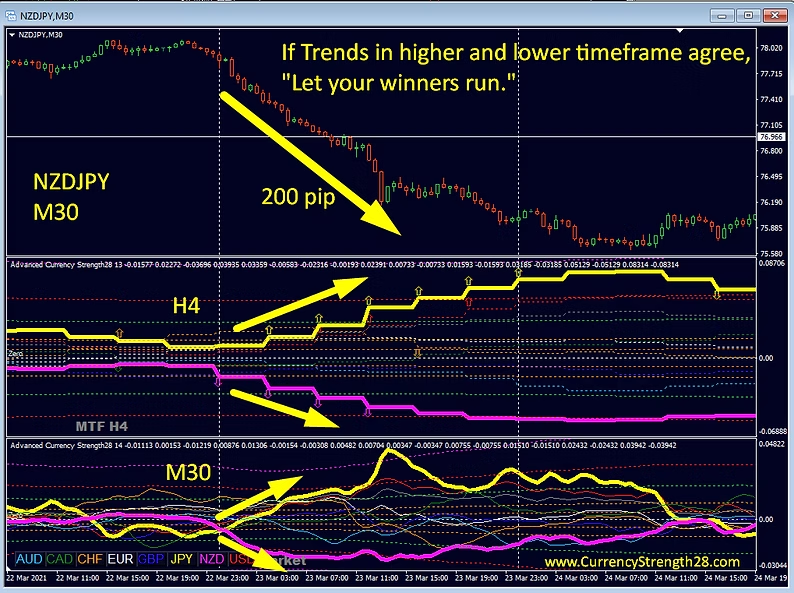
Try to find above rules in the picture below:

The top-down method with multi-timeframe analysis.
There are no limits to how many timeframes you can choose. However, the appropriate timeframe must be carefully selected (see post above).
Understanding the underlying market trend and then developing strategies around it is one of the critical aspects of successful Forex trading. Trends can also exist in different time frames at the same time. As a result, conflicting trends can emerge depending on which time frame is used for a particular currency, or currency pair.
Traders often get stuck following only one timeframe and ignore the stronger primary trend that may be occurring in a higher time frame. Not only can they lose sight of the larger trend, but they can even miss clear supply and demand zones and consequently appropriate entry and exit points. This is why multiple time frame analysis is so useful when trading.
It is always best to go with the direction in the larger time frame.
The direction/trend you may see in the shorter timeframe - if it is opposite of the one in the higher time frame - should not last for too long.
Then when trends align, you can take full advantage of the momentum during those times and let your winners run.
We are not finished yet. Back to the topic of "Trading TREND or REVERSAL or BOTH?".
We now understand that it is important to stay in the trend of the higher time frame (HTF), but the lower time frame (LTF) may or may not agree with it. Let's see how we can best deal with this.
Currency Strength Method
Scenario both time frames to match, Trend-Trend setups (beginner traders). LTF: dGAP on ACS28, CS within 100/-100 MFib, Impulse indicator trigger.
Scenario the timeframes do not match, Trend-Reversal setups (experienced trader). LTF: Hook alert on ACS28, CS comes from 161/-261 MFib iGAP, Impulse indicator trigger with a flip. The LTF was against the HTF, but now we see a reversal signal. This reversal on the LTF is actually a continuation of the HTF and can give great reward against low risk. Let your winners run!
Supply and Demand Method:
In an uptrend on Advanced Supply Demand, you could be looking for a demand reversal alert or a demand fake breakout (FBO), or a break of the supply zone.
In a downtrend on Advanced Supply Demand, one could look for a Supply Reversal Alert or a Supply Fake Breakout (FBO), or a Demand Zone Break.
TP:
Find a good entry zone and see if there is enough room to trade.
Advanced Supply Demand or SDDP gives enough room for a TP to the next supply/demand zone. I prefer to use the supply/demand zones of some higher time frames and can ignore lower time frames.
SL:
SL a few pips above the supply or below demand zone depending on buying or selling. It should not be too far away. Try to get Reward/Risk (RR) better than 1. Rule: an SL should be at a place where the setup will be invalid if the price gets there.
Hundreds of trade examples and info find in the links mentioned here:
Trading example on EURAUD, using a combination mentioned above.
The daily trend was still down and the lower time frames were opposite, but pulled back from Supply. It was confirmed with an iGAP of ACS28 from extreme levels and a speed flip of the Impulse Indicator. The TP was perfect on the pip just above demand.

MT4 Products -> https://www.mql5.com/en/market/mt4?Filter=bernardo33
MT5 Products -> https://www.mql5.com/en/market/mt5?Filter=bernardo33
Happy trading, best regards Bernhard


Comments